Insights:
When the UI Becomes the Bottleneck
1. The question
I spent over five years on the Vault UI on-prem team. From day one until my last day, one request came up again and again: API pagination.
The answer was usually some mix of “it’s complicated” or “we can't because of the storage layer.” Having since moved into Customer Engineering and dug deep into the infamous storage layer, I get it — it really is complicated.
But the reality is simpler: browsers don’t do well rendering massive payloads. The UI team tried to simulate pagination using Ember Data caching and incremental rendering, but under the hood the API still returned everything. As a result, users often complained about slow lists or even broken pages.
So let’s put numbers to what we already know: the API can handle scale, but the UI struggles when lists get large.
And yes, I’ve heard pagination is in progress. So maybe this is a moot point, but consider it proof in numbers that this is a real issue.
The question
Do the API the UI handle serving up thousands of items with the same performance?
2. The setup
- Tools:
vault-benchmarkfor backend load, Chrome HAR captures for UI latency. - Workload: KVv2 secrets engine with large (~100-field JSON) secrets and 1000+ entries.
- RPS levels tested: 300, 500, 700, 900, 1100, 1500.
- Actions recorded: list, read, write, and delete
3. Backend Results (Vault API)
The backend performed exactly as you’d hope.
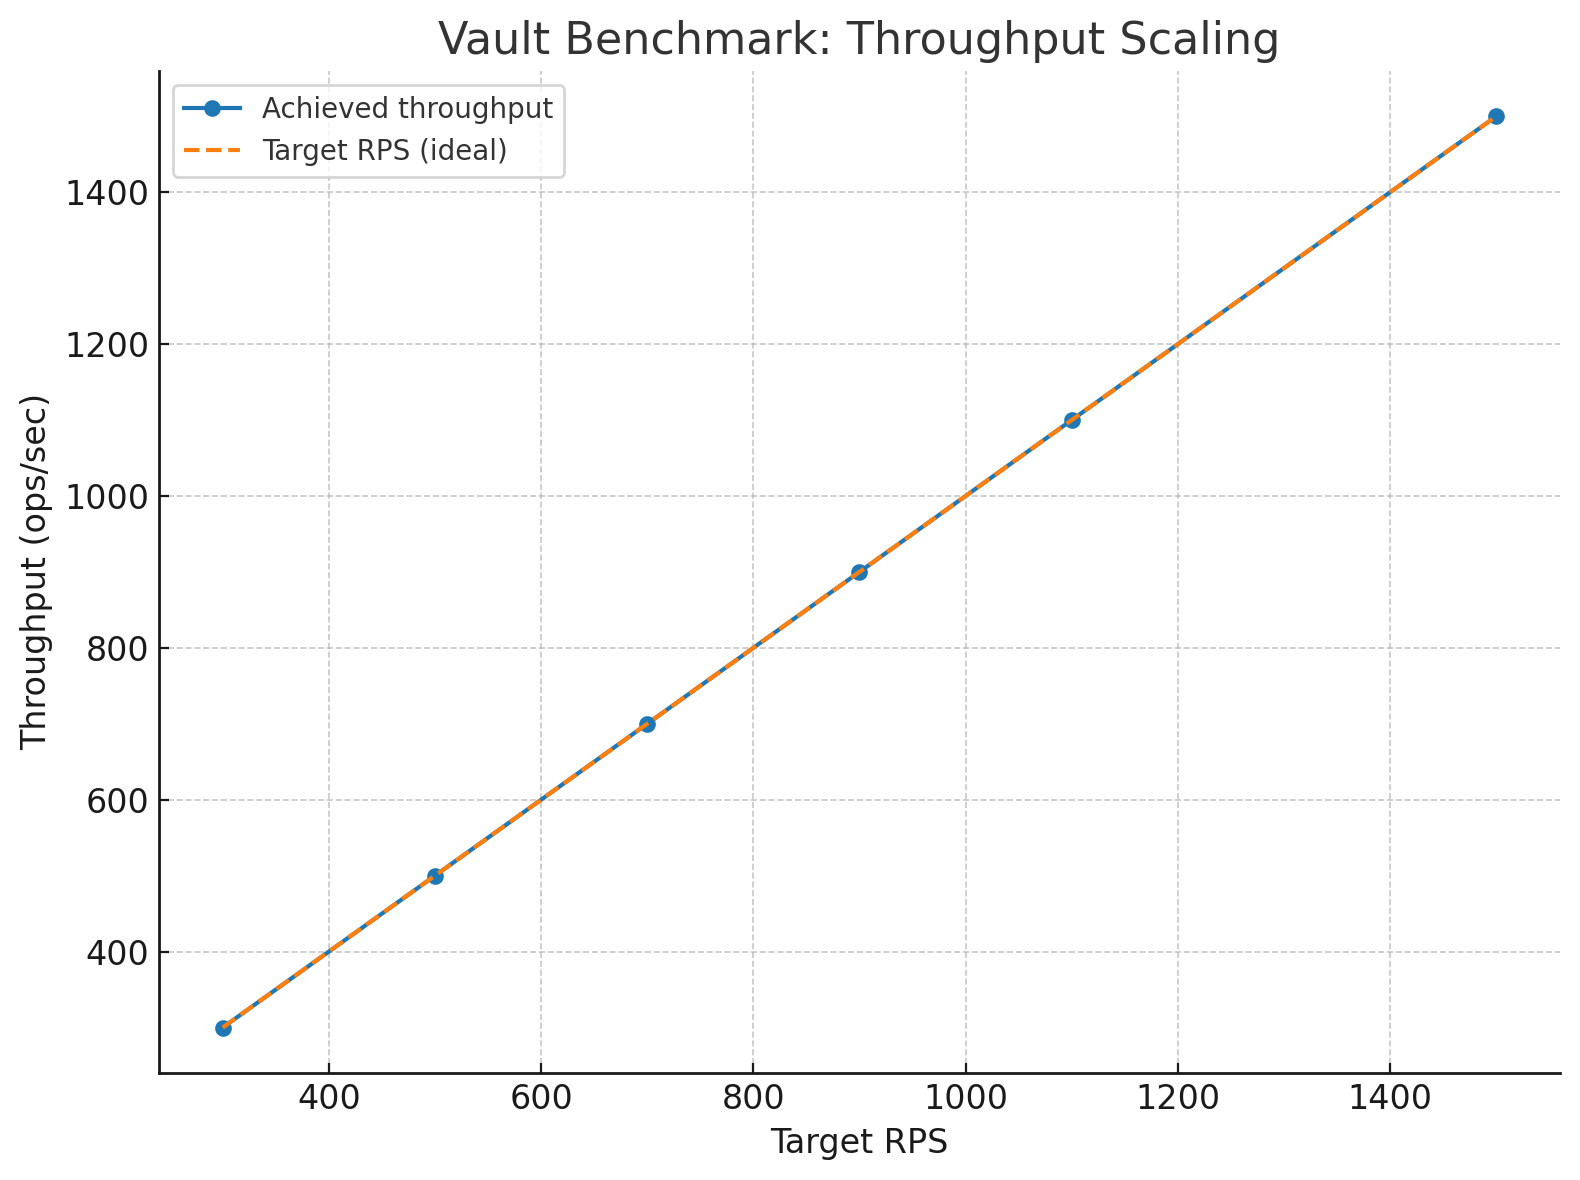
Throughput matched the target requests per second all the way up to 1500.
Reads vs Writes
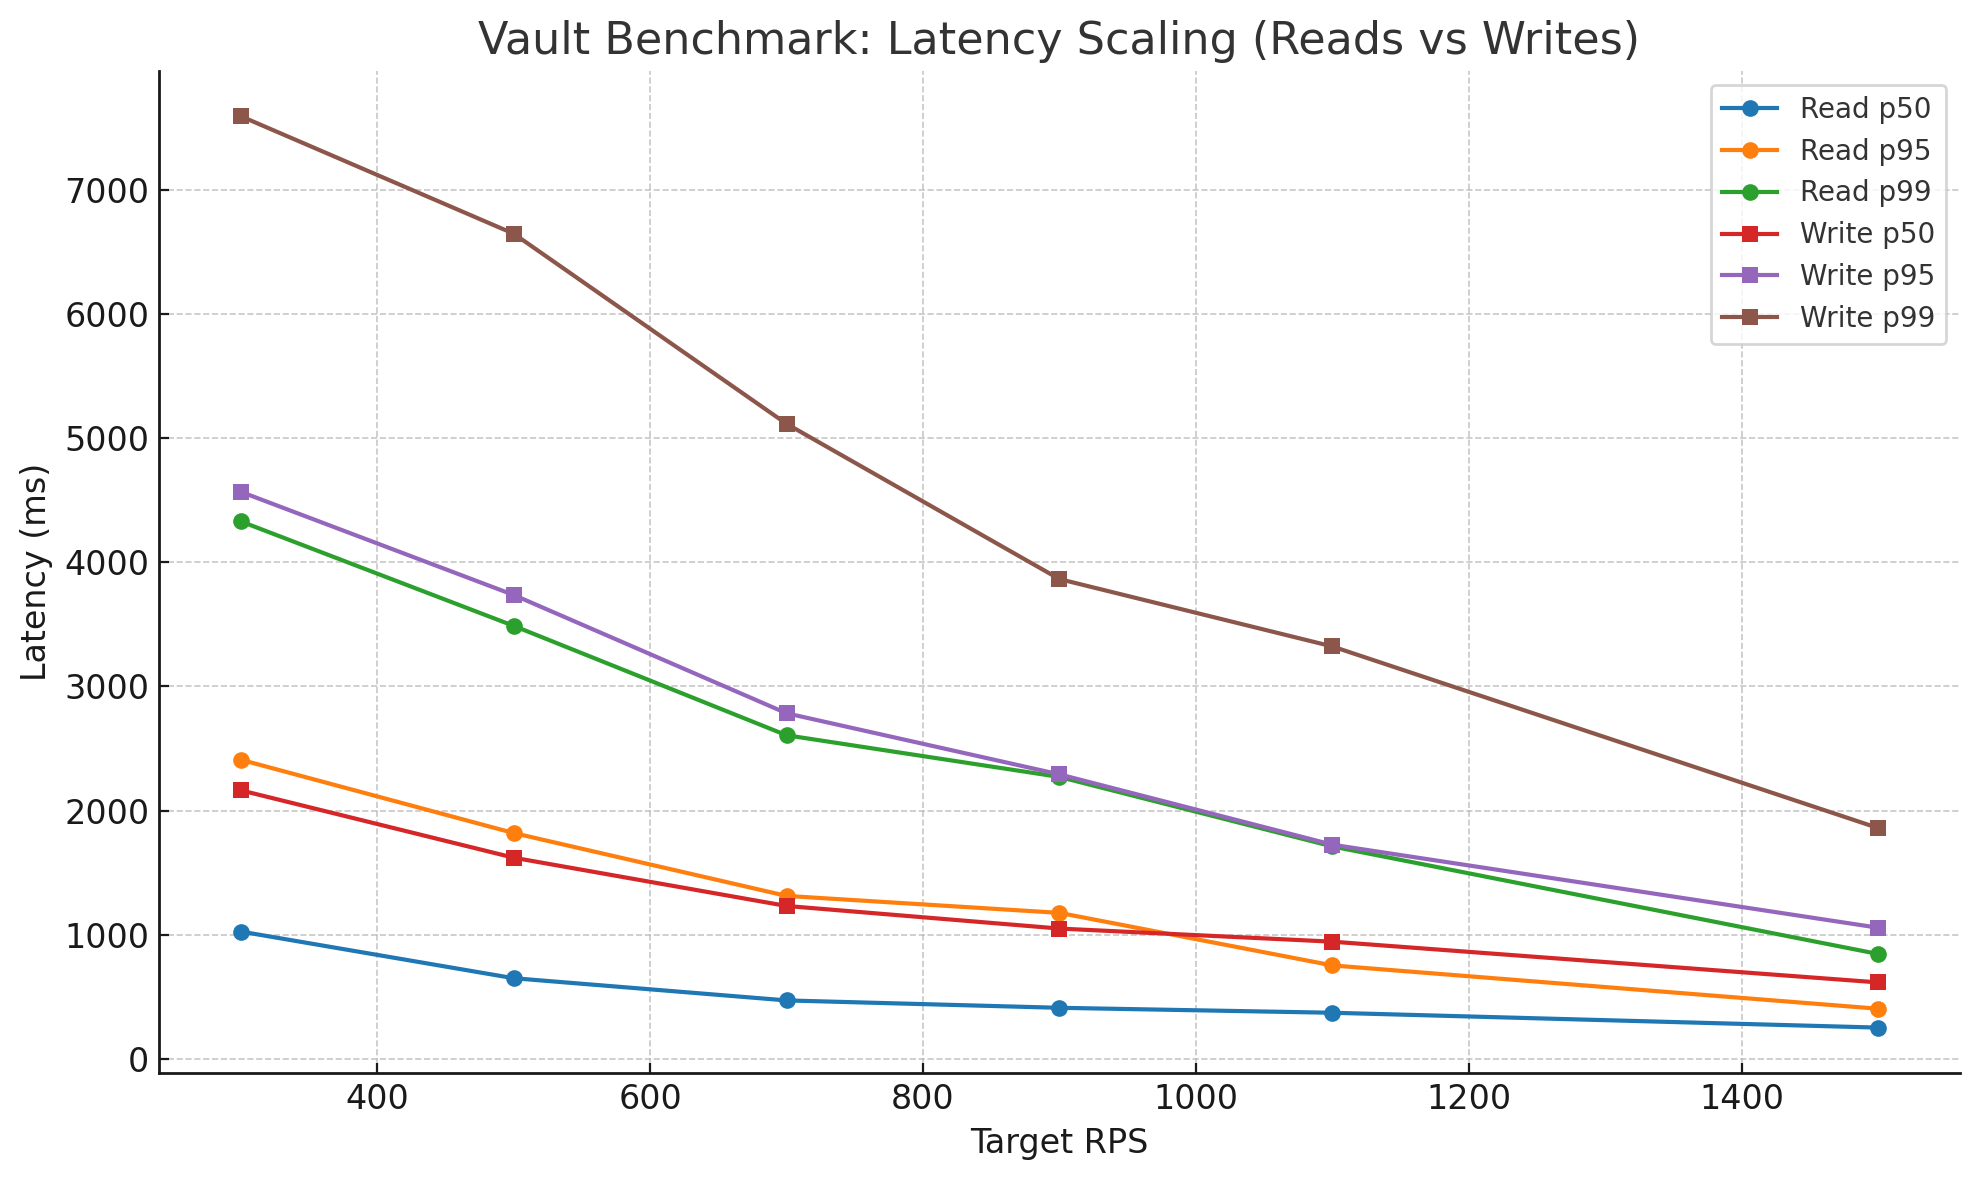
- Reads: median <1ms, p95 ~1-2ms.
- Writes: median ~1 ms, p95 ~2 ms, p99 <4 ms.
No “knee” point was observed at these loads. Writes are slightly slower but follow a consistent curve.
4. UI Results (HAR Analysis)
The UI told a different story.
_all.png)
- Median latency stayed ~2–3 ms.
- p95 crept up into 8–13 ms.
- p99 spiked to 15–35 ms.
The backend was fine, but the UI introduced tail stalls as lists got larger. The user perception of “slowness” came from the UI, not the API.
5. Backend vs UI Contrast
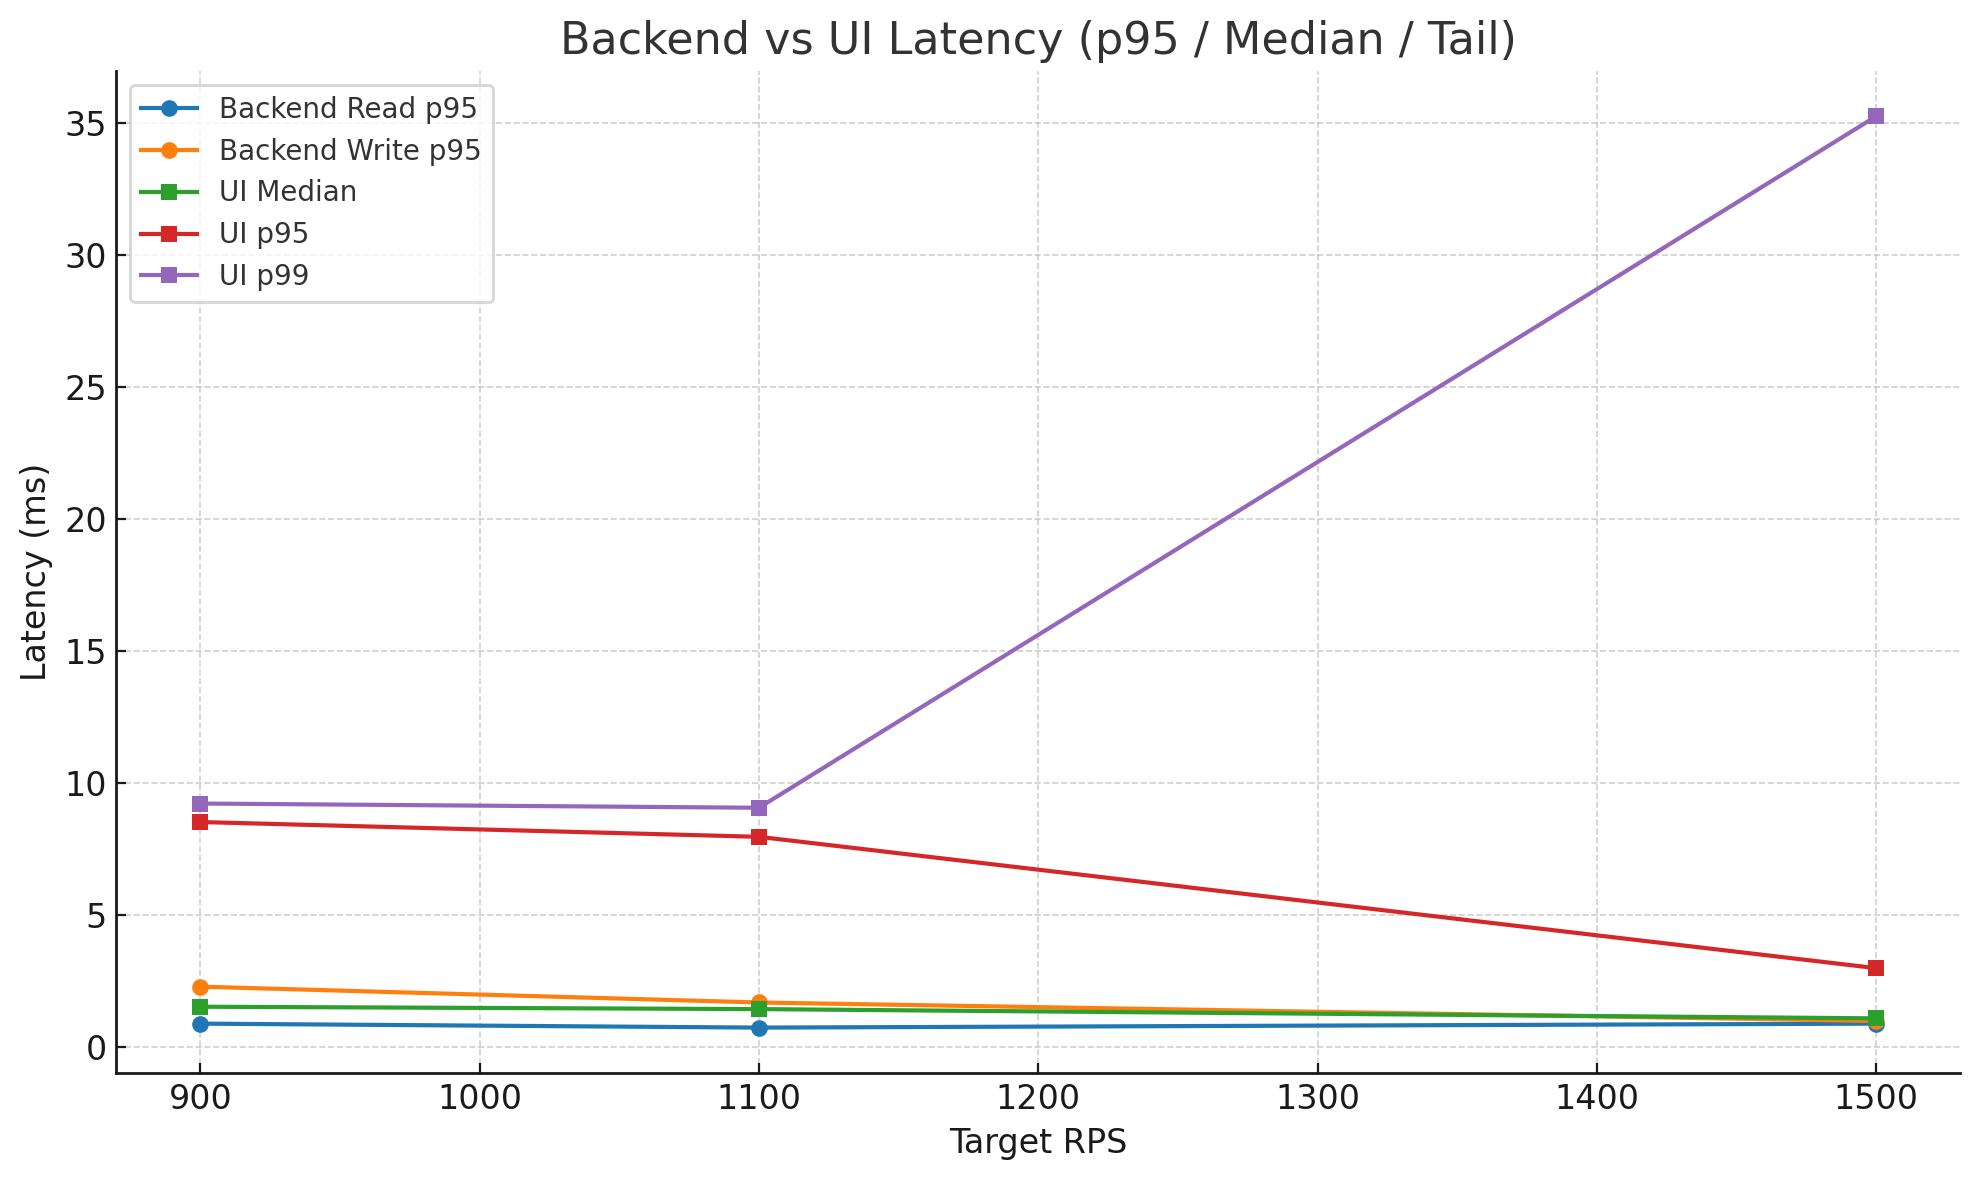
- Backend p95: ~1–2 ms.
- UI p95: 5–10× higher.
- UI p99: 30–40 ms.
The p99 spikes were concentrated around list views. Reads, writes, and deletes remained low-latency — in fact, they often looked better at higher RPS.
6. Root Cause: List Endpoints Without Pagination
- Vault API’s
listendpoint returns all keys under a path. - With thousands of secrets, that’s a massive payload.
- The UI has no choice but to fetch everything all at once. It even tries to prevent latency by caching the payload and only rendering in batches of 100, but that is not enough.
The result: the backend scales, but the UI struggles.
7. Proposal
Add pagination flags to the API’s list endpoint. Even basic chunking would let the UI keep pace and avoid rendering bottlenecks.
8. Takeaway
1. Vault’s backend scales linearly to 1500+ RPS with sub-2 ms p95 latency — no knee point observed.
2. The UI median stays fine (~2 ms), but p95/p99 latency spikes 5–10× higher, up to 30–40 ms.
3. This happens because even though the UI renders in batches of 100, it still:
- downloads the entire payload,
- blocks on a single JSON.parse,
- normalizes every record into the store,
- builds indexes/search structures on the full set, and
- triggers GC pauses from large allocations.
4. Those heavy bursts show up as tail stalls (p95/p99), creating the perception of slowness.
5. The real fix is server-side pagination (and keys-only list responses), so the UI only works with what it needs up front instead of chewing through thousands of records at once.